
We are professional in delivering software solutions that drive growth.
We are a team of professionals dedicated to providing innovative software solutions, reliable cloud monitoring, and scalable microservices. At JMETA Solutions Technologies, professionalism is at the core of everything we do — ensuring your business grows with confidence in the digital era.
Read More
At JMETA Solutions Technologies
we take pride in delivering reliable software solutions, professional cloud monitoring, and scalable microservices to help your business grow.
Read More
In certain times, businesses face challenges that require smart solutions
At JMETA Solutions Technologies, we provide reliable software services, cloud monitoring, and microservices architecture to help companies overcome these challenges and achieve sustainable growth.
Read MoreComplete visibility into your applications, on your own infrastructure
Modern applications fail in distributed, hard-to-reproduce ways — a slow database call three services deep, an exception that only appears under load, a dependency that degrades silently. JMeta Application AI Observer was built to close that gap: it gives your engineering team a single, coherent view of what every request actually did, and an AI layer that can explain why it failed, without any of your telemetry ever leaving infrastructure you control.
Where most observability tooling asks you to choose between depth of insight and operational simplicity, JMeta Application AI Observer is designed to require almost no integration effort — instrument a service in minutes via configuration, not a rewrite — while still capturing the level of detail an engineer needs at 2 a.m. during an incident.
- Unified telemetry → Logs, metrics, and distributed traces collected over the open OpenTelemetry (OTLP) standard and correlated automatically by request, across every service.
- Very easy configuration → Add one client dependency and a handful of properties — no rewrites, no manual span instrumentation, no infrastructure changes. Most services are reporting data within minutes.
- Simple, uncluttered interface → Logs, metrics, traces, and alerts live in one clean dashboard built around fast search — no proprietary query language to learn and no switching between tools.
- AI-powered root-cause diagnosis → One click reads a failing trace's spans and correlated logs and explains the likely cause in plain language, with a suggested fix.
- AI that's always available → If the language model is offline, diagnosis falls back automatically to a clear, rule-based summary — you always get an answer, never a blank screen.
- Signal over noise → Exceptions are fingerprinted and grouped automatically, so one recurring failure shows up as one issue, not a flood of duplicates.
- Extensible by default → Ship custom business metrics and events alongside the automatic telemetry, using the same client library.
- Multi-tenant architecture → Every organization's data, dashboards, API keys, and alerts are isolated automatically — built to serve more than one team or customer from a single deployment.
- Runs anywhere → Native Java (Spring Boot) and Node.js client libraries, with the platform itself deployable via Docker Compose or Kubernetes alongside the rest of your stack.
Built for Your Stack
Native client libraries and deployment support for the technologies engineering teams already run.
Java

Spring Boot

Node.js
Kubernetes
Why Engineering Teams Choose It
Six principles guided how JMeta Application AI Observer was designed.
One Platform, Not Three
Logs, metrics, and traces live in one dashboard and are correlated by request — no switching tools or manually stitching a trace ID across systems.
Very Easy Configuration
Add a client dependency, set a few properties, and HTTP and database calls are traced automatically — production-ready observability without a rewrite or a single line of manual instrumentation code.
Simple, Clean Interface
A single, uncluttered dashboard built around fast search rather than a complex query language — find the log line, trace, or metric you need in a click or two.
AI That Reads Your Trace
Diagnosis is grounded in the actual spans and log lines of the failing request — a specific answer, not a generic summary of a metric graph.
AI That's Always There
If the language model is offline, diagnosis falls back automatically to a clear, rule-based summary — the "Diagnose with AI" button always gives you an answer.
Self-Hosted & Private
Every signal, and every AI diagnosis, is processed on infrastructure you control. Nothing is sent to a third-party SaaS or an external model provider.
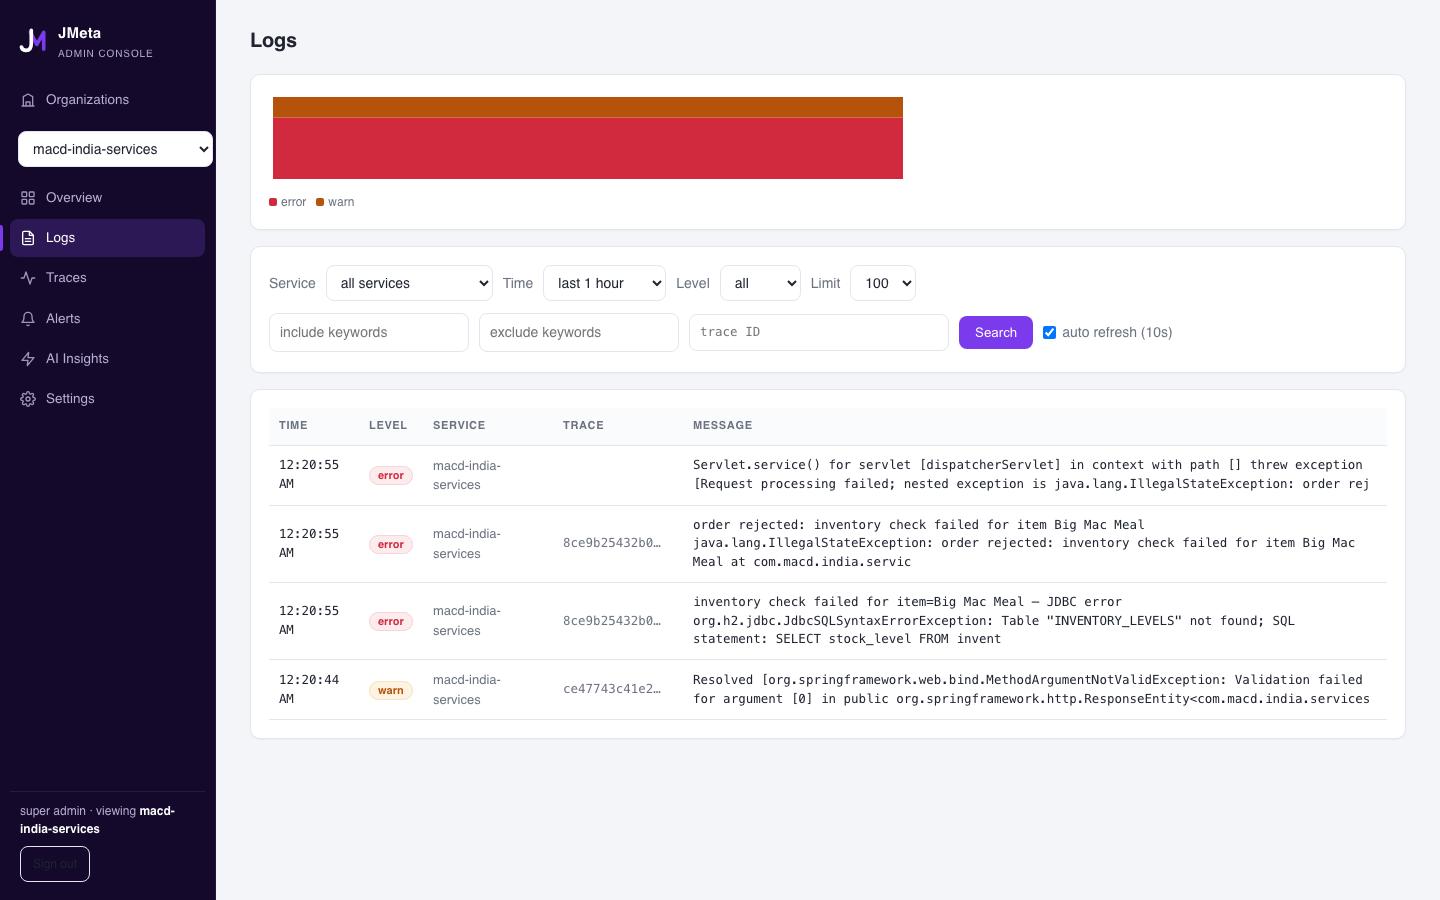
Find the line that matters, in seconds
Every log line is searchable by service, severity, time range, and keyword, backed by a live volume histogram broken down by level — so a spike in errors is visible before it becomes an incident. When a line catches your eye, one click follows it to the exact distributed trace it belongs to, with no need to copy a trace ID between screens.
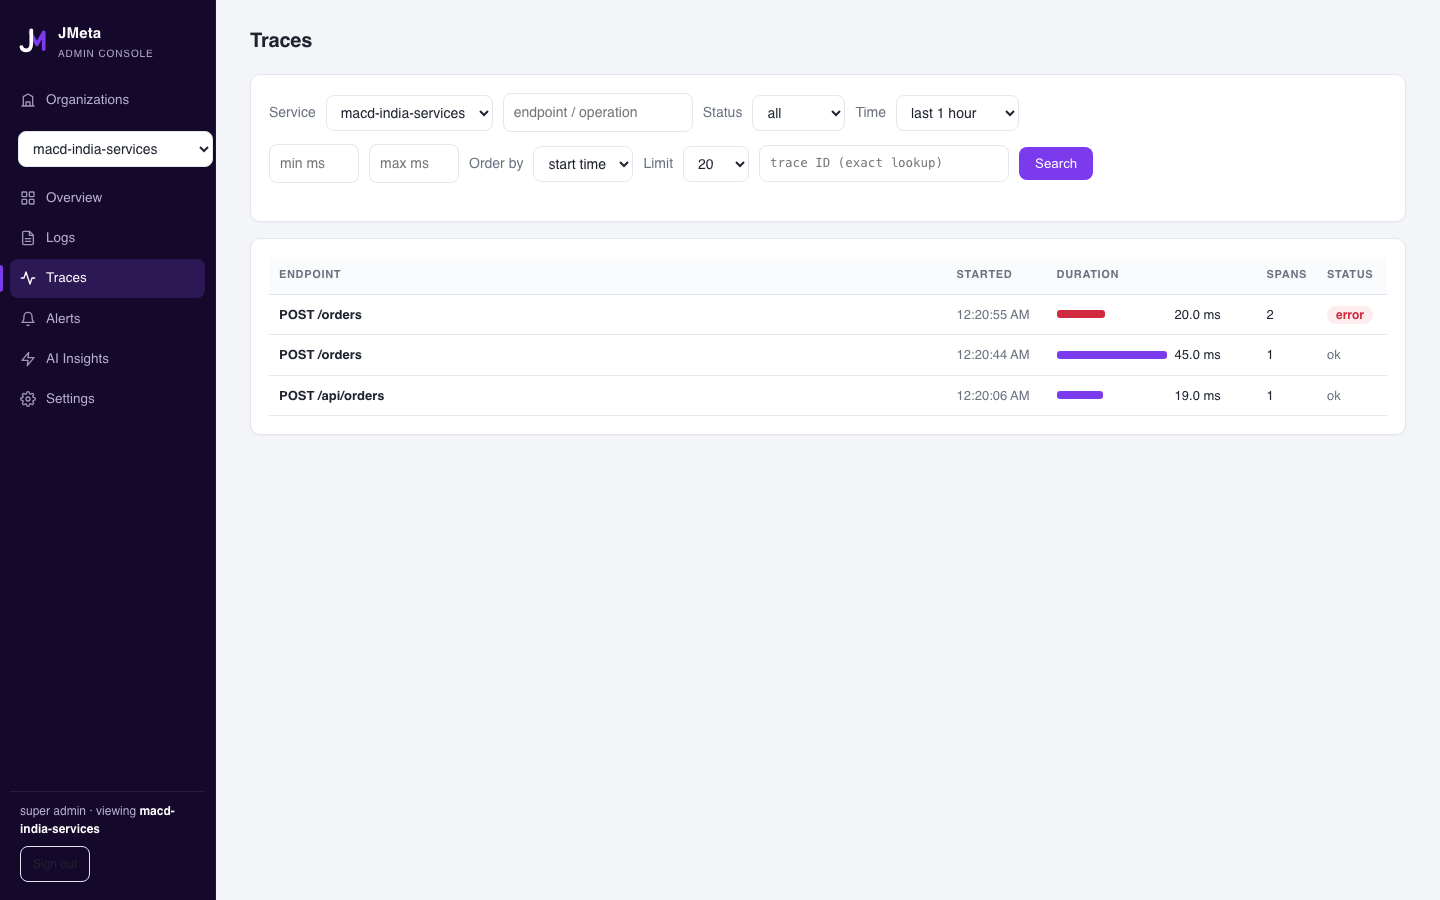
See the request the way it actually happened
Every trace shows the full call path of a request — every span, its exact timing, and whether it succeeded — filterable by service, endpoint, duration, or error status. HTTP calls and database queries are instrumented automatically, so the trace that shows up in the dashboard already reflects what your code did, without additional annotation.
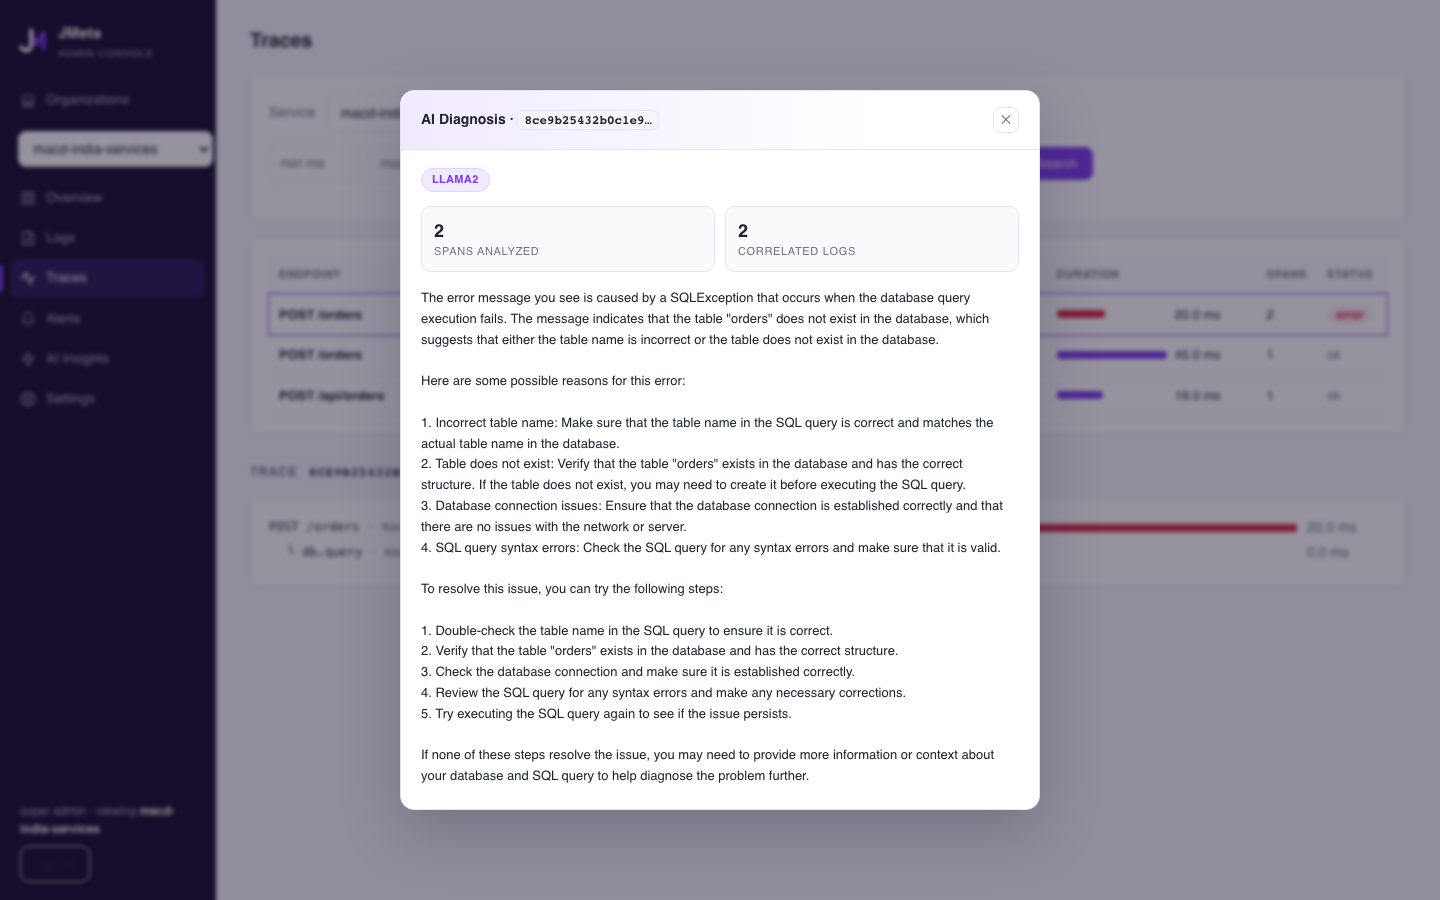
From "something broke" to "here's the fix"
Select "Diagnose with AI" on any failing trace, and JMeta Application AI Observer assembles that request's full span timeline together with its correlated log lines, then asks a locally-hosted language model to identify the exact failing operation and propose a concrete fix. The entire analysis — prompt, model, and response — runs on your own infrastructure, so incident data never has to leave your environment to get an answer.
See JMeta Application AI Observer on Your Own Stack
Talk to us about deploying JMeta Application AI Observer for your applications — we'll walk you through integration, deployment, and what it looks like on your own services.
Contact Us